Tuesday, December 8, 2009

How many years are left in the current commodities production?

looks like some commodities wont last into the near future....
a road map to which commodities might stage major rally's in the next 30+ years due to constrained supply

How much "money" out in the world will soon chase the power money?


looks like Niagara falls trying to fit through a garden hose

Tuesday, December 1, 2009

GOLD $1200 - CHECK, where to next?


in the overnight action Gold came within 50 cents of the $1200 mark before retreating back to the 1192 area, the bank of japan statement about QE certainly made the Asian traders move some money into physical power money pretty quick. the selling pressure was quickly absorbed as $1200 has now been taken out. the question is where to from here and in how long?

there has been much word of china now wanting to increase their Gold reserves to 5000ton or even 10000 Ton, this combined with nearly every other central bank in the world wanting to actually purchase gold is going to consume every ounce of gold being mined.
the road to $5000 will be quicker than most think
all along the way the non-believers will be saying it has peaked.....

Thursday, October 22, 2009

S&P 500 and USDX

the S&P 500 and the DX index are still moving in lockstock inversion, this chart posted by Bespoke over the past week shows how negitively correlated the two are....

Tuesday, October 20, 2009

Gold out performing the $USD?

just glancing at the Finviz relative performance graphs it was interesting to see that Gold actually outperformed the USD on a strong dollar day..... this is rather odd as we know usually a strong dollar day relates into a massive sell off in gold, this should be interesting to see how a weak dollar will now effect gold

Bank of Canada holds Rate steady

today the bank of Canada Held the rate at 0.25% and the currency markets acted as they should, the CDN lost over 2% at one point during the day. it seems as if traders were at first expecting a rate hike similar to the Aussies

we can see on the 10min bar chart after the 9:00 am announcement the USD/CDN ran nearly 225 pip's..... bigest one day loss for the CDN in over 4 months


on the daily bar chart the CDN$ might be oversold and due for a minor correction, this could last up up around the 1.08 to 1.09 area

Monday, October 19, 2009

Great Chart of The CDN in US$ terms and major currency terms

Heres a chart from Rosenberg... this shows how the CDN dollar isnt just a USD story but supported by a multitude of currencies. It appears as if the world is chasing a currency backed by hard assets, the AUD wchart would look very similar to this.


Tuesday, October 13, 2009

GOLD new record high

I've been meaning to post about this for the last couple days or so.....

its clear now that the initial target of 1250 and 1650 are in target real soon

I've posted some of the updated charts on the golds dec contract with an analysis of the indicators. on the fundamental side its clear that central banks around the world are looking to get out of the dollar and are diversifying their foreign reserves as fast as they can, especially the 800 lbs gorilla in the room china. the appitite of Asian investors for the yellow shinny stuff is totally different than in the western world. here we have advertisements of "cash 4 gold" and "we buy your gold" it seems as if Asian investors are holding on to the metal as it is their insurance and has no where to go but UP from here.

here is the latest chart, on the daily bar chart the candle stick formation and trend appear very strong..... the MACD has crossed over and the Divergence is now positive, the RSI is approaching 70 but this strength should continue and not act as a contarian selling point, the TRIX has also crossed over..... the rally should last for at least a week or two more before a pullback


heres a look at the 60min bar chart taken a little bit later, the 60 min is showing a very nice trend

Wednesday, September 30, 2009

Comparison of charts in differnt time frames

i've included a few CDN currency charts in the daily and 60min views to give a perspective of the trends i'm following at the moment between the EUR/CDN and USD/CDN as well as this first one in a weekly and daily view

This is New Gold, ticker NGD on the tsx and nyse

the daily view shows a strong trend channel thats its nicely following, a breakout of this channel and we can easily see $6 as the first target
RSI looks slightly oversold and has room to rally quite a bit more


Expanding to the weekly view this $6 target can become visible as well as the strong trend channel


We all know tracking currencies is the name of the game right now, follow that trend and you'll follow the money, the USD has been breaking down hard since march and right now the CDN dollar which as commodity play has been benifiting quite well.... this trend on the Daily chart seems to be in full effect still with the Large Bearish candle today and the RSI still nearing overbought levels,


the 60 min chart is showing some oversold singals at this point therefore the USD could have a slight rally here before the trend continues again


i rarely look at the EUR/CDN as most of the volume of trading is done in the USD/CDN but i figured it was worth a look
the trend seems very similar to the USD pointing to the downside for the EUR against the CDN


on the 60 min chart things seem slightly over sold right at the moment but the overall long term trend would be to the downside

Thursday, September 24, 2009

The 22 Rules of Trading

These 22 rules of trading were written by Dennis Gartman Back in 2005, these like many other similar rules of trading focus on the obvious when you step back and examine the big picture of what trading is all about and how its properly done; i believe we must constantly read over rules such as these in order to fully understand where a particular trade is heading and if we are in our right mind when making decisions. the more one follows certain guidelines it becomes like second nature


1. Never, under any circumstance add to a losing position.... ever! Nothing more need be said; to do otherwise will eventually and absolutely lead to ruin!

2. Trade like a mercenary guerrilla. We must fight on the winning side and be willing to change sides readily when one side has gained the upper hand.

3. Capital comes in two varieties: Mental and that which is in your pocket or account. Of the two types of capital, the mental is the more important and expensive of the two. Holding to losing positions costs measurable sums of actual capital, but it costs immeasurable sums of mental capital.

4. The objective is not to buy low and sell high, but to buy high and to sell higher. We can never know what price is "low." Nor can we know what price is "high." Always remember that sugar once fell from $1.25/lb to 2 cent/lb and seemed "cheap" many times along the way.

5. In bull markets we can only be long or neutral, and in bear markets we can only be short or neutral. That may seem self-evident; it is not, and it is a lesson learned too late by far too many.

6. "Markets can remain illogical longer than you or I can remain solvent," according to our good friend, Dr. A. Gary Shilling. Illogic often reigns and markets are enormously inefficient despite what the academics believe.

7. Sell markets that show the greatest weakness, and buy those that show the greatest strength. Metaphorically, when bearish, throw your rocks into the wettest paper sack, for they break most readily. In bull markets, we need to ride upon the strongest winds... they shall carry us higher than shall lesser ones.

8. Try to trade the first day of a gap, for gaps usually indicate violent new action. We have come to respect "gaps" in our nearly thirty years of watching markets; when they happen (especially in stocks) they are usually very important.

9. Trading runs in cycles: some good; most bad. Trade large and aggressively when trading well; trade small and modestly when trading poorly. In "good times," even errors are profitable; in "bad times" even the most well researched trades go awry. This is the nature of trading; accept it.

10. To trade successfully, think like a fundamentalist; trade like a technician. It is imperative that we understand the fundamentals driving a trade, but also that we understand the market's technicals. When we do, then, and only then, can we or should we, trade.

11. Respect "outside reversals" after extended bull or bear runs. Reversal days on the charts signal the final exhaustion of the bullish or bearish forces that drove the market previously. Respect them, and respect even more "weekly" and "monthly," reversals.

12. Keep your technical systems simple. Complicated systems breed confusion; simplicity breeds elegance.

13. Respect and embrace the very normal 50-62% retracements that take prices back to major trends. If a trade is missed, wait patiently for the market to retrace. Far more often than not, retracements happen... just as we are about to give up hope that they shall not.

14. An understanding of mass psychology is often more important than an understanding of economics. Markets are driven by human beings making human errors and also making super-human insights.

15. Establish initial positions on strength in bull markets and on weakness in bear markets. The first "addition" should also be added on strength as the market shows the trend to be working. Henceforth, subsequent additions are to be added on retracements.

16. Bear markets are more violent than are bull markets and so also are their retracements.

17. Be patient with winning trades; be enormously impatient with losing trades. Remember it is quite possible to make large sums trading/investing if we are "right" only 30% of the time, as long as our losses are small and our profits are large.

18. The market is the sum total of the wisdom ... and the ignorance...of all of those who deal in it; and we dare not argue with the market's wisdom. If we learn nothing more than this we've learned much indeed.

19. Do more of that which is working and less of that which is not: If a market is strong, buy more; if a market is weak, sell more. New highs are to be bought; new lows sold.

20. The hard trade is the right trade: If it is easy to sell, don't; and if it is easy to buy, don't. Do the trade that is hard to do and that which the crowd finds objectionable. Peter Steidelmeyer taught us this twenty five years ago and it holds truer now than then.

21. There is never one cockroach! This is the "winning" new rule submitted by our friend, Tom Powell.

22. All rules are meant to be broken: The trick is knowing when... and how infrequently this rule may be invoked!

Wednesday, September 23, 2009

Sept 23 Market Commentary - Gold and Oil

Crude Inventories were released today and there was a build of over 2.8 million barrels insted of the decrease they were expecting of 2.25 Barrels.... you can see the reaction of the traders; needless to say a difference of 5 million barrels is still rather significant even with the falling USD


here is an up date of the daily Gold chart:


this is the chart with a 5 min bar to show the effect after the FOMC meeting, it was almost like a rocketship


Monday, September 21, 2009

Martin Armstrong - Japan and Its Future After the LDP

I believe we can Learn a lot from what happened in Japan and why it happened, as well as ways that we can prevent it from happening here in North America. The great experiment in Japan with their QE program and political spin shows us there is no quick fix for the aftermath of such a huge credit expansion and asset appreciation like what was experienced in Japan Circa 1980's, granted the situation here is was not nearly as extreme especially considering this paper talks about two such pension funds in the late 80's having assets worth in over $1 Trillion USD, which is unprecedented even 20 years later


Japan and Its Future After the LDP

Martin Armstrong - Cycle Theory

This goes into some of the concepts and the Basics behind his cycle theory, also how its has come about.... well worth the Lengthy read


Cycle Theory 9/09


Cycle Theory & the Sixth Dimension Part II 9/09

Thursday, September 17, 2009

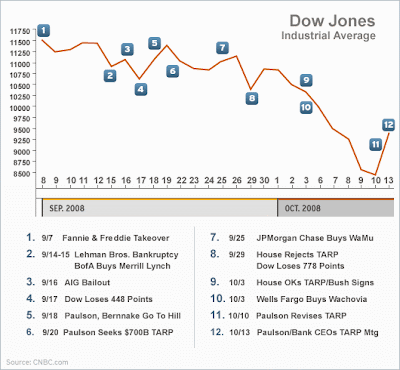
Last September was a busy Month

we can certainly say last September had a lot going on..... Major events which have altered the financial world landscape in the years to come, to see some of the biggest and promenant names disapear or be absorbed all within the same month is astonishing. I can cleary remember being glued to CNBC and Bloomberg watching the history unfold.
heres a timeline of that faiteful month:


Total US Government Obligations At $118.6 Trillion - commentary from Sprott

It's just $118 Trillion..... nothing to see here.... keep moving along folks

Sprott September

Wednesday, September 16, 2009

Review of Natural Gas Hammer call from Sept 4th

On sept the 4th we noticed a Major Hammer in the Natural Gas commodity, from that point it has rallied by almost 30%!
we'll review what it looks like now and where it was posted as a good entry position
a major move for only 12 days....
Here's what it looked like as of this morning:

Here is where we saw the Low risk Entry opportunity:

At the Moment, i am still holding a Natural Gas long in the form of the ticker HNU but i am looking to sell some of the position very soon


Monday, September 14, 2009

Speculation as a fine art

I've recently just readthe booklet "Speculation as a fine art" which was written by Dickson G. Watts in the 1880's. This was written long before one of my favorite books "Reminiscences of a stock Operator" the story of Jesse Livermore, it was mentioned by Jesse at one point "Watts wrote the book on speculation" i had never found until recently exactly what book that was.
listed below are 4 absolute laws Watts' believed in following when trading. I find it incredible that trading rules which were around 130 years ago are still true today


LAWS ABSOLUTE.
1. Never Overtrade. To take an interest larger than the capital justifies is to invite disaster. With such an interest a fluctuation in the market unnerves the operator, and his judgment becomes worthless.

2. Never "Double Up"; that is, never completely and at once reverse a position. Being "long," for instance, do not "sell out" and go as much "short." This may occasionally succeed, but is very hazardous, for should the market begin again to advance, the mind reverts to its original opinion and the speculator "covers up" and "goes long" again. Should this last change be wrong, complete demoralization ensues. The change in the original position should have been made mod- erately, cautiously, thus keeping the judgment clear and preserving the balance of the mind.

3. "Run Quickly," or not at all; that is to say, act promptly at the first approach of danger, but failing to do this until others see the danger, hold on or close out part of the "interest."

4. Another rule is, when doubtful, reduce the amount of the interest; for either the mind is not satisfied with the position taken, or the interest is too large for
safety. One man told another that he could not sleep on account of his position in the market; his friend judiciously and laconically replied: "Sell down to a sleeping point."
He also had some Conditional Rules as well, i have just highlighted one which i find important:

3. In all ordinary circumstances our advice would be to buy at once an amount that is within the proper limits of capital, etc., "selling out" at a loss or profit, according to judgment. The rule is to stop losses and let profits run. If small profits are taken, then small losses must be taken. Not to have the courage to accept a loss, and to be too eager to take a profit, is fatal. It is the ruin of many.


Friday, September 11, 2009

All about the Jobs

Taking a Quick look at the unemployment situation in the U.S. we can quickly see that its far worse for those unemployed now than back in the 02'- 03' recession, looking at over 6 unemployed per job opening! That makes for some tough competition
*charts from Rosenberg


naturally looking at the job opening's we can see that it shows an inverse correlation to the chart above


this chart goes back a bit further than just the recent decade giving a much longer term perspective on hiring intentions by firms, drastically worse than the 02' recession and now passing right through the low of 91'.....

Wednesday, September 9, 2009

off the chart unemployment over 27 weeks in the U.S

that is a scary looking chart of the unemployed for 27 weeks and over..... going back to the late 40's. granted the population has expanded greatly, it still give you an idea of the shear number of people unemployed in the US throughout the 60 years of recessions


Looking at a normally bullish formation occuring in the USD

taking a Look at the USD from sept 8th close we can see the somewhat bullish wedge formation occuring in the Daily bar chart. however i would also like to point out the weekly chart which paints a different picture..... if the weekly chart breaks this has quitge a bit of pull down to the 72 region like a magnet.


Tuesday, September 8, 2009

comparison of unemployment in 1929 to present

okay the depression comparisons and scenarios have been almost been written off for quite a while now but i think its offical that the comparison between unemployment then and now is nothing alike.
chart from the big picture


Friday, September 4, 2009

Solid Hammer in Nat Gas

looks as if a decent hammer has been put in place by Natural Gas, if you're looking to go long now is a pretty attractive opportunity to capture some of this move up.... might not be the ultimate bottom in natural gas but certainly a tradable one considering the size of the hammer put in place, not to mention the RSI at the extreme level its at if you were to play the Contraian investor.


Gartman unsure of what is going on right now

Gartman doesnt seem to understand the reason for the Gold market and its recent rally.... i wonder what he's going to think in a few months when the investment demand in Gold is going to soar


Thursday, September 3, 2009

Martin Armstrong - Will Gold Reach 5000+


a great read in what will become like the Internet stocks of the late 90's..... when this really starts to take off watch the general public rush into it like a storm. Soon it will be talk of junior miners which will have made people fortunes virtually overnight...


Will Gold Reach 5000+? 809 height="500" width="100%" > value="http://d.scribd.com/ScribdViewer.swf?document_id=19199220&access_key=key-1ns97yhiivb1484xwz81&page=1&version=1&viewMode=">

Gold broke through its very large triangle

well the precious metal's bull market is about to kick into the next gear, Gold has now broken out of its triangle and i suspect it has taken out many stop buys on the way thru...... just wait until it punches though the $1000 round number mark. soon there wont be anything but air above it.
after the breakout it will run up to about $1100 and then come back and test somewhere in the 1000 mark but it wont stay there for long before heading up to $1250.


Tuesday, September 1, 2009

The Rise and Fall of the USD purchasing power

taking a Look at the Puchasing Power of the USD the full effects of inflation are realized, that long term trend looks to be continued..... it will take quite a bit to reverse it at this point

definatly worth a quick look over


Personal Saving as reported by the Gov statistics and the cash personal savings, cash personal savings seem to have gone divergent in the late 1950's


Monday, August 31, 2009

Insider selling at all time highs

from bloomberg the other day, insider selling is at extreme levels compared to buying


Friday, August 28, 2009

New Piece by Martin Armstrong - the Biggest Bull in the room?

Okay maybe he's not the biggest Bull in the room but he is certainly predicting the dow to 30,000 by 2015! his economic confidence model has been dead on for the past 20 yrs in key turning points of markets. he's looking for a test of the march 2009 lows by 2011 and then it will be off like a rocket.

the only reason i can see a 30,000 dow would be a massive devaluation in the dollar, we're seeing that at this moment.... for the dow to drop back to the march 2009 lows and the the dollar to continue its devaluation the two would have to become positively correlated insted of the negitive correlation they currently have.

great read none the less

Will the Dow Reach 30,000 by 2015? 0809

Thursday, August 27, 2009

Secular Bear Markets

Great Chart from Ritholtz's Blog showing the four stages of secular bear markets.... compiled by Morgan Stanley Europe. this is a great chart showing because it doesnt just include the U.S. bear markets it is compiled from bear markets around the world at various times.... history tends to repeat itself in one form or another

something to consider when thinking about where we are in the cycle

Investor Intelligence bullish and bearish levels


from a contrainian perspective one might see this as a topping formation in this rally... what happens when everyone decides to "take some money off the table" all at once. Its not that fact of short sellers that make a market correction in order, its the lack of buying in the market

Monday, August 24, 2009

Possible good Entry Point on Natural Gas

for the past Month or 2 i believe i have seen Multiple set-up on great Entry points in Natural Gas only to have it break down a week or two later to new lows. it seems today was another good possible entry for playing the very Volatile commodity on a multi year chart from slopeofhope Tim points out on a 17yr Log chart the potential support, yes that support could easily be broken and we travel all the way down to $2 or so


as Bespoke points out the ratio of Oil to Natural Gas has never been at such extreme Ratios in the past 20 yrs.... could be a sign of Oil either breaking down or a large Rally in Natural gas. i'm thinking its the latter which will take place


a Brief Look at the Monetary situation in the US


Total Federal Debt.... looks like it has gone Parabolic. can things go straight up forever? or does the old saying what goes up must come down come into effect at some point? well certainly not in the next decade according to Tresurary running a $9 TRILLION defict in the next 10 yrs


well it'll be okay as long as the reciept's of tax income comming in are increasing just as fast, oooh wait.... those have nearly fallin off a cliff


As i would expect the amount of debt as a percentage of disposable income would be decreasing by sane rational individuals


now that is a truly scary chart

Friday, August 21, 2009

Gold looking posed to POP

Look at the ascending Triangle in the GLD, the heavily traded Dec GC contract looks even better but the GLD will do for this purpose.
we're looking more and more likely for a major breakout come Sept or Oct.. just getting positioned correctly now will pay off big

S&P 500 high broke to new highs for 2009

all that dollar devaluation has lead to the S&P 500 reaching new highs for 2009, what will happen when the dollar reachs 72? will the S&P be back at 1200 and unemployment at 10.5%??


Look out Below!

well its about time that dollar started to accelerate it's decline, this should be confirmed when we breach that 77.43 level and then from there 76, then 72 and possibly in the 60's is in order.


Thursday, August 20, 2009

Warren Buffet talking about the demise of the USD

Looks like the Nail is in the coffin for the Buck, it's only a matter of time until the general public accpects what is comming.... a much lower standard of living in the US

Buffett: Debt Mountain Could Turn America Into A Banana Republic (BRK)
Joe Weisenthal|Aug. 19, 2009, 6:48 AM|38
PrintTags: Economy, Economy, Debt, Money, Federal Reserve, U.S. Government, Warren Buffett

Berkshire Hathaway CEO Warren Buffett, a supporter of Barack Obama and an indirect beneficiary of the bailouts, writes in a NYT op-ed to warn about the crushing mountain of debt the US government is now building up.

After laying out the staggering numbers, he concludes thusly:

I want to emphasize that there is nothing evil or destructive in an increase in debt that is proportional to an increase in income or assets. As the resources of individuals, corporations and countries grow, each can handle more debt. The United States remains by far the most prosperous country on earth, and its debt-carrying capacity will grow in the future just as it has in the past.

But it was a wise man who said, “All I want to know is where I’m going to die so I’ll never go there.” We don’t want our country to evolve into the banana-republic economy described by Keynes.

Our immediate problem is to get our country back on its feet and flourishing — “whatever it takes” still makes sense. Once recovery is gained, however, Congress must end the rise in the debt-to-G.D.P. ratio and keep our growth in obligations in line with our growth in resources.

Unchecked carbon emissions will likely cause icebergs to melt. Unchecked greenback emissions will certainly cause the purchasing power of currency to melt. The dollar’s destiny lies with Congress.

U.S. Defict

When does the Math state the U.S. Income can no longer cover the Expenditures? what will it take to get these two back in correlation... i believe its beyond the point of no return


Wednesday, August 19, 2009

3 bear markets


taking a look at the differences in 3 bear markets including the current one